What Predicts a Primary Winner?

What Predicts a Primary Winner?
Six dimensions, 18 races, nearly 100 candidates and a discovery that changes how you read the electoral map. PharosGraph tested every signal in our pipeline against March's certified primary results and found that the dimensions that predict Republican winners are fundamentally different from the ones that predict Democrats.
PharosGraph ran 18 races through our pipeline this March, comparing pre-election analyses against certified election results from North Carolina, Texas, Georgia and Illinois.
Our pipeline evaluates each candidate across six dimensions:
- Issue alignment: how closely a candidate's stated positions match the issues voters in that district care most about, scored using AI analysis of public statements, debate transcripts, and campaign materials
- Socio-demographic affinity: how strongly a candidate's support base maps to the demographic makeup of the electorate, measured across 19 dimensions including education, income, age, and race
- Prediction markets: the probability assigned to each candidate by real-money betting markets like Polymarket and Kalshi, which aggregate the collective judgment of informed observers
- Media visibility: a candidate's media footprint based on news coverage volume and search-trend intensity, capturing name recognition and momentum
- Moral salience: how candidates frame their messaging across ten dimensions of moral reasoning (such as empathy, fairness, loyalty, and authority), based on Jonathan Haidt's moral foundations framework
- Narrative framing: how media coverage portrays each candidate: as a Hero (positive framing), Villain (negative framing), Victim, or Neutral
These six scores combine into a single composite ranking for each candidate.
Across these twelve races, the pipeline correctly identified front-runners and competitive tiers across the board. But the most actionable insight was structural: the signals that predict Republican primary winners are fundamentally different from the ones that predict Democratic primary winners. Political professionals have long sensed this intuitively. Now we can quantify it and show exactly which dimensions matter, for which party, at which level of office.
Prediction Markets: The Strongest Single Signal
Prediction market probability (the real-money odds placed on each candidate by bettors) was the strongest single signal in our pipeline. Markets placed the Democratic winner in the top two in all seven competitive primaries. On the Republican side, markets were right more often than not, but notably missed in Texas, where Polymarket had Ken Paxton at 63.5% and Cornyn won by 1.7 points. That's a case where PharosGraph's issue alignment score got it right and the markets didn't.
Markets aggregate information that no model can observe directly: endorsement networks, fundraising momentum, volunteer capacity, internal polling. They tell you who's winning but not why. For the strategic intelligence underneath, you need to look at what's driving the signal. That's where the party-level patterns emerge.
Republican Primaries: Visibility, Issue Clarity, and Narrative Framing
On the GOP side, three signals stood out.
Issue alignment correctly identified the Republican front-runner in five of six competitive primaries. When GOP primary voters agree on most issues but differ on emphasis and positioning, the candidate whose stated positions most closely match voter priorities wins. John Cornyn's win in Texas is the case study: prediction markets heavily favored Ken Paxton, but Cornyn's issue alignment (driven by his incumbency-backed positioning on trade, defense, and border security) correctly predicted he'd lead the vote count by 1.7 points. The pipeline saw what the markets didn't.
Visibility (a candidate's media footprint measured through news coverage and search trends) went five for six as well. Darren Bailey's media presence from his 2022 gubernatorial run gave him a visibility score more than double his nearest competitor's in the Illinois Governor GOP primary, and he won with 54%. Michael Whatley's RNC chairmanship powered the strongest visibility signal in the NC Senate field. Jennifer Davis led visibility in the IL-8th and won.
Narrative framing revealed a pattern unique to GOP primaries. Republican candidates across the board receive very little positive "hero" framing in media coverage; most scored below 5%. But certain candidates receive substantial negative "villain" framing, particularly on culture-war issues like immigration, abortion, and LGBTQ+ rights. In Texas, Ken Paxton carried the highest villain score in the entire March dataset (14.8%), driven by coverage of corruption allegations, abortion enforcement, and LGBTQ+ litigation. Rather than hurting him with the GOP base, that framing may signal the kind of combative positioning that resonates in a Republican primary. Paxton finished just 1.7 points behind Cornyn and forced a runoff. Greg Abbott carried a 6.0% villain score (on abortion and border policy) alongside his 7.7% hero score and won with 82%.
The pattern: in Republican primaries, being cast as a villain on certain issues may function as a signal of base alignment rather than a liability. We'll be watching the Cornyn-Paxton runoff (May 26) closely for further evidence.
The Republican takeaway: visibility, issue clarity, and (potentially) combative narrative framing on base-alignment issues are the signals to watch in upcoming GOP primaries.
Democratic Primaries: The Component-Level Story
Democratic primaries surfaced a different pattern and a deeper layer of intelligence.
The composite ranking consistently placed the eventual Democratic winner in the competitive tier, with the winner finishing #2 in five of seven races. But the signals that separated candidates within that tier were different from the GOP side. Visibility and issue alignment, dominant for Republicans, were less predictive for Democrats. The intelligence that identified Democratic winners lived in the individual dimensions within each signal, not the rolled-up scores. When we decomposed each signal into its components, three findings stood out.
Hero Framing Tracks Democratic Winners
The narrative framing dimension showed a clear pattern in Democratic primaries. The candidate with the highest "hero" framing (positive media portrayal) won in five of eight contested races, including every statewide primary: James Talarico led hero framing at 16.9% in the Texas Senate race and won with 53%. Gina Hinojosa led at 21.9% in the Texas Governor race and won with 60%. In the Illinois 7th, La Shawn Ford led at 23.0% and won. Daniel Biss led at 18.6% in the hotly contested Illinois 9th (the race with $12M+ in outside spending) and won by 3.3 points.
This is consistent with what PharosGraph has observed in prior cycles. In the 2025 NYC Mayoral race, the NJ and VA Governor races, and the Tennessee 7th House race, higher hero framing correlated with stronger performance. In the Tennessee 7th, Democrat Aftyn Behn carried the highest hero score in the field and significantly overperformed historical Democratic performance in that deep-red district.
The contrast with Republicans is striking. Democratic winners are defined by positive media framing: empathy, advocacy, community protection. Republican winners are not. Hero scores for GOP candidates are uniformly low (most under 5%), and the candidates with the highest villain scores on issues like immigration and abortion are often the most competitive with the base. The narrative framing dimension reads differently by party, and campaigns should interpret it accordingly.
Care Messaging Predicts Statewide Democratic Winners
PharosGraph's moral foundations analysis maps candidate rhetoric to ten dimensions of moral reasoning, measuring not just what a candidate says but the moral register they use to say it. Dimensions include Care (empathy and protection), Fairness (justice and equity), Loyalty (group belonging), Authority (respect for institutions), and Sanctity (moral purity), among others. Each candidate receives a score on each dimension based on AI analysis of their public communications.
One dimension, Care, which captures language around empathy, protection, and harm prevention, predicted the winner in all three statewide Democratic primaries.
The Illinois Senate primary is the clearest case. Juliana Stratton won with 40% against Raja Krishnamoorthi (33.2%) and Robin Kelly (18.2%). Krishnamoorthi had higher visibility and led the field on the Fairness dimension. But Stratton's Care score of 82.7 (versus Krishnamoorthi's 71.7) captured something the other signals didn't. In a primary where three Democrats agreed on the issues, the candidate who spoke to protective instincts (expanding healthcare access, community safety, shielding families from harm) beat the candidate who led on procedural equity and systemic reform.
Care also correctly identified James Talarico (TX Senate) and Gina Hinojosa (TX Governor). Three for three in statewide Democratic primaries. The pattern: when Democratic primary voters are choosing between credible candidates who agree on policy, the one whose rhetoric activates empathy wins.
At the House level, Care was less predictive. Scale matters. In statewide races, voters have enough exposure to candidates' messaging for the Care signal to register. In district races, other dynamics take over.
A second moral dimension added consistency: Sanctity (moral purity, sacredness). The winner placed in the top half of the field on Sanctity in all seven Democratic primaries, the only dimension with a perfect record. Winners don't need to lead on Sanctity, but they can't trail on it.
Coalition Structure Predicts House Winners
If Care is the statewide signal, what predicts Democratic House primaries?
We decomposed the socio-demographic affinity score (which measures how a candidate's support base maps to the district's demographics) into its 19 individual dimensions. One jumped out: the degree to which a candidate's support varies by education level. The Democratic House winner had the most education-differentiated support base in all four contested races, a perfect 4 for 4.
This isn't about which candidate appeals to college graduates. It's about which candidate has built a structurally coherent base around the demographic dimension that most sharply defines Democratic primary electorates. Donna Miller's south suburban coalition in IL-2nd. La Shawn Ford's ward-level support in IL-7th. Melissa Bean's base in IL-8th. Daniel Biss's progressive coalition in IL-9th. Each showed the sharpest support differentiation by education in their field.
A second dimension, voter turnout patterns, was nearly as strong. Five of seven Democratic winners had support concentrated most heavily in the precincts with the highest turnout. Winners' bases were where people actually vote. Combined with education differentiation, these two dimensions correctly identified 6 of 7 Democratic winners, revealing signal that the rolled-up aggregate blends away.
The 21-Candidate Stress Test
Georgia's 14th district special election (twenty-one candidates, both parties, jungle primary format) tested the pipeline at scale. The composite ranking placed Democrat Shawn Harris #1. Correct: Harris led the actual field at 37.3%. Four of the actual top five finishers appeared in the model's top five. Harris also carried the highest hero framing score (11.5%) among competitive candidates, consistent with the Democratic pattern.
The moral foundations analysis captured the partisan structure precisely. Harris dominated Care, Fairness, and Harm (progressive moral dimensions); Republican Clayton Fuller, who finished second at 34.9%, dominated Authority, Loyalty, and Sanctity (conservative moral dimensions). With 18 Republicans splitting the conservative vote, identifying which candidates to take seriously was more valuable than predicting the exact order. In a 21-candidate field, that tier identification is the intelligence that helps campaigns and media buyers allocate resources.
What to Watch in the Primaries Ahead
March's findings produce different playbooks by party:
Republican primaries: The Ohio Senate special election (May 5) features a two-candidate GOP primary where visibility and issue alignment will be the key differentiators. Alabama Senate (May 19) has a 15-candidate field where tier identification (sorting the competitive top three from the rest) will be more valuable than a winner prediction. The Ohio and California Governor races will test whether villain framing on base-alignment issues continues to track with GOP competitiveness.
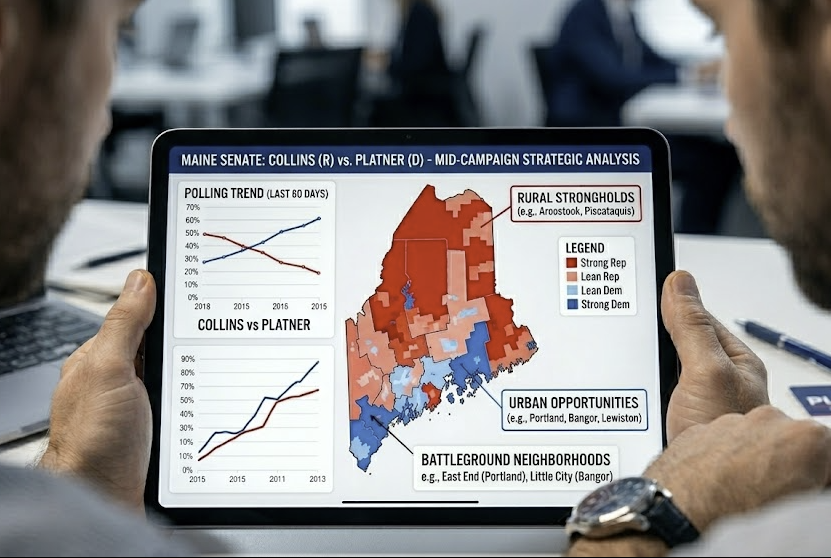
Democratic primaries: The Maine Senate primary (June 9) features seven candidates including Governor Janet Mills, making it a strong test of the Care messaging signal at the statewide level. The California Governor jungle primary (June 2) puts 16 candidates on one ballot, including Katie Porter, Xavier Becerra, and Antonio Villaraigosa, and will be the biggest field-size test of tier identification since Georgia's 14th. The Michigan Senate primary (August 4) may be the most telling test case of the cycle: Mallory McMorrow has strong grassroots support while Haley Stevens has the highest name recognition. If March's patterns hold, McMorrow's coalition structure and hero framing will be more telling than the visibility gap.
Texas Senate runoff (May 26, Cornyn vs. Paxton): The most direct test of the villain-framing hypothesis. Paxton's 14.8% villain score (the highest in our March dataset) against Cornyn's near-neutral profile will show whether combative narrative framing consolidates or alienates the GOP base in a head-to-head contest.
What This Means for November
Primary season is the calibration window, and the signals that differentiate within a party become the signals that differentiate between parties in the general.
Issue alignment is built for inter-party competition. Same-party candidates agree on the issues; general-election opponents don't. In a Cooper-vs-Whatley general in North Carolina, the issue contrast is massive: Cooper's healthcare positioning, backed by his Medicaid expansion record, against Whatley's lack of healthcare specifics. PharosGraph's precinct-level analysis can map exactly where that contrast creates persuadable voters.
Moral foundations map cleanly onto the partisan divide. Stratton's Care-dominant profile against the Republican nominee's Authority/Loyalty profile is the kind of moral-terrain contrast the pipeline was designed to surface, and it translates directly into precinct-level messaging strategy.
Narrative framing becomes a different signal in generals. The hero/villain dynamics that play differently by party in primaries converge into a single competitive frame. Candidates who built strong positive narratives in their primaries carry that into the general; candidates whose villain framing resonated with their base may face a different reception with swing voters.
Coalition intelligence carries forward. The organizing infrastructure that wins Democratic primaries becomes the GOTV machinery for November. Candidates who built grassroots coalitions arrive at the general with a structural asset, and PharosGraph's demographic analysis can map where that asset is strongest.
For campaigns and media buyers: the signals that matter shift as the calendar turns from intra-party to inter-party competition. The campaigns that adjust their signal weights accordingly will have a meaningful edge over those running the same playbook all cycle.
The Bottom Line
Across twelve races this March, PharosGraph's pipeline identified competitive tiers, surfaced party-specific predictive signals, and uncovered intelligence at the component level that broader aggregates obscure.
Republican primaries reward visibility, issue clarity, and combative positioning on base-alignment issues. Democratic primaries reward positive media framing, empathy-driven messaging, and structurally coherent coalitions built around education and turnout.
The insight is in knowing which dimensions to weight for which context. Reading the data at the right resolution reveals what the top-line rankings don't.
The kind of analysis in this post (identifying which signals matter, where the vulnerabilities are, and what moves the needle) is what PharosGraph delivers at scale. For any candidate, party, or interest group, in any race from U.S. Senate to city council, PharosGraph can produce a complete audience brief identifying the specific neighborhoods to target, on which issues and with what message, to gain a competitive advantage and spend campaign dollars more efficiently.
To learn more or to explore race-level data, contact us at info@pharosgraph.com.


The Suburban Bloc That Could Swing the 2026 Texas Senate Race

What Local TV Ad Sales Teams Are Missing in Political