Inside Our Virginia Prediction: Neighborhood-Level Accuracy on a Statewide Referendum
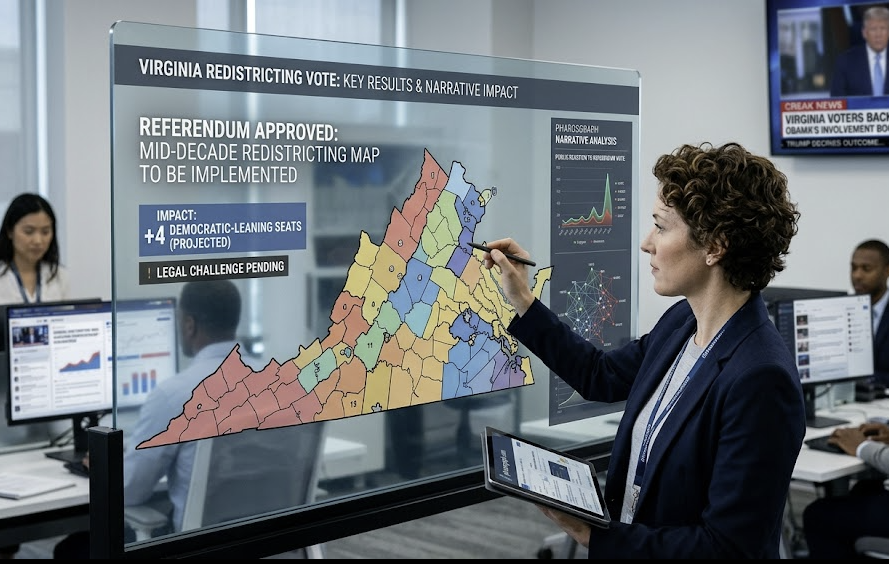
PharosGraph segmented 5,963 Virginia neighborhoods before the redistricting vote. We went back and checked our work.
On April 21, Virginia voters narrowly approved HJ 4, the congressional redistricting amendment, by a margin of 51.6% to 48.4%*. The result landed in a contested space that most conventional polling struggled to pin down with precision.
Six days before the vote, PharosGraph's BallotScape pipeline issued a projection and a full audience segmentation covering every neighborhood in Virginia. We segmented 5,963 Census Block Groups into four audience tiers and produced strategic recommendations for both sides of the referendum. Now that the results are in, we went back and checked our work.
The topline
Our projection called YES at 53%. The actual result was 51.6%. That's within 1.4 percentage points, issued nearly a week before election day while the NO coalition was executing its heaviest advertising push. We called the direction, the competitive geography, and the overall margin within a range that any campaign operator could act on with confidence.
But the topline number was never the point. PharosGraph is an audience intelligence platform. The real question is: did our neighborhood-level segmentation correctly identify where YES and NO support would materialize?
The audiences delivered
We divided Virginia into four audience tiers: Mobilize (the YES base), Persuade (swing neighborhoods), Inoculate (lean-NO areas to monitor), and Concede (strong NO territory). Here's how each tier performed against the actual vote:
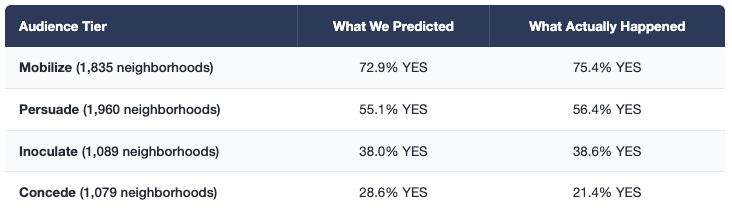
The Mobilize segment stands out: 98% of the neighborhoods we identified as base YES support actually delivered over 55% YES. On the other end, 93% of Concede neighborhoods came in below 35% YES. The model drew the lines in the right places where it matters most: identifying the base on both sides.
The targeting test
For any audience product, the ultimate test is simple: if a campaign followed your targeting recommendations, would they have spent money in the right places?
Neighborhoods in our activation set delivered 65.4% YES. Neighborhoods we deprioritized delivered 30.7% YES. That's a 35-point gap between where we said to invest and where we said to save your resources.
The audiences outperformed our own expectations. Any programmatic media buy, canvassing operation, or voter engagement effort built on this segmentation would have been deployed correctly.
Where it gets interesting
An accuracy analysis is only useful if you learn from where the model fell short, not just where it hit. And part of what we do is layer paid media tracking on top of our audience data, so we can see not just who the voters are, but what messages are reaching them and whether those messages are landing.
The Roanoke-Lynchburg corridor is the clearest example. Heavy NO advertising saturated that market in the final week, and the lean-NO neighborhoods we had flagged as vulnerable voted over 67% NO — more than we projected. Our audience scoring identified that vulnerability, and the NO side's advertising exploited it exactly the way we would have recommended in a NO campaign brief. That's where our miss in Roanoke-Lynchburg concentrated. In our Mobilize neighborhoods here, however, despite being exposed to the same heavy NO spend, voters still ended up supporting the amendment by a margin of nearly three to one, roughly in line with what we projected. A campaign using PharosGraph's audience tiers could have avoided wasting dollars on opposition neighborhoods that were never going to flip and concentrated on the ones where the message was actually changing minds.
Rural Southside Virginia tells the opposite story. We identified 87 neighborhoods there as activation targets for the YES side, and flagged 40 of them specifically as turnout priorities. The audience intelligence was right: the demographics support YES. But the YES campaign had no ground operation in Southside, and the NO coalition was running targeted advertising through community networks in those same neighborhoods. The data identified where YES investment could have moved the needle, but without a ground operation to act on it, latent YES support never converted to votes.
In suburban swing territory like Stafford, Spotsylvania, and the Virginia Beach suburbs, the miss went the other way. Our Persuade neighborhoods broke more decisively for YES than we projected. The model read these areas as contested; voters had apparently already made up their minds. For a campaign, this is a good miss: you'd rather over-invest in persuasion on friendly ground than ignore it.
What this means
Election night validates what we've built PharosGraph to do: measure the political landscape at a resolution that matters for real campaign decisions. Not just who is going to win or lose, but where support lives, where it's soft, and where investment can move the needle.
Virginia's redistricting vote was a genuinely hard test. A special election on a constitutional amendment, with no candidate on the ballot, during a period of intense late-breaking advertising. The model held up. The audiences worked. And where they didn't, the patterns are explainable and point to specific improvements we're already building into the next generation of the pipeline.
All-in-all: PharosGraph correctly mapped the competitive terrain of this election at the neighborhood level, days before voters went to the polls.
Want to see what this kind of audience intelligence looks like for a race or ballot measure you care about? We'll send you a complimentary brief. Reach out at info@pharosgraph.com.
*Results as of April 22, 2026 (100% of precincts reporting; mail-in ballots still being tallied). Neighborhood-level validation based on spatial crosswalk of 5,963 Census Block Groups to 2,208 Virginia voting districts.


The Suburban Bloc That Could Swing the 2026 Texas Senate Race

What Local TV Ad Sales Teams Are Missing in Political